
Read your dashboard
Inseller shows you profit, not just sales. That means some numbers are settled facts and some are still estimates — and the dashboard tells you which is which, if you know where to look. This page is about not misreading it.
Revenue is a fact. Fees and cost are partly estimates until the platform settles, and Inseller tells you the exact share that is still estimated instead of hiding it. A number with an estimate inside it is still useful — as long as you know it is there.
 1
2
3
1
2
3
The period line — check this first
Above the tiles sit two labels that decide what every number below them means:
| Label | What it tells you |
|---|---|
| REPORTING PERIOD This month · 08/01 ~ 08/11 (11d) |
The window being measured. Note the (11d) — a month-to-date view is 11 days of data, not a full month. |
| COMPARED TO PRIOR PERIOD 2026-07-01 → 2026-07-11 |
What every ↑/↓ percentage is measured against. It is the same number of days in the previous month, not the whole month. |
Comparing 11 days against a full previous month would make every month-to-date view look catastrophic until the 28th. Inseller compares like for like — so a red arrow on the 11th is a real decline, not a calendar artefact.
Each tile also carries as of 11 Aug. That is the last day included, and it is your cue that today may still be filling in.
The Data trust banner
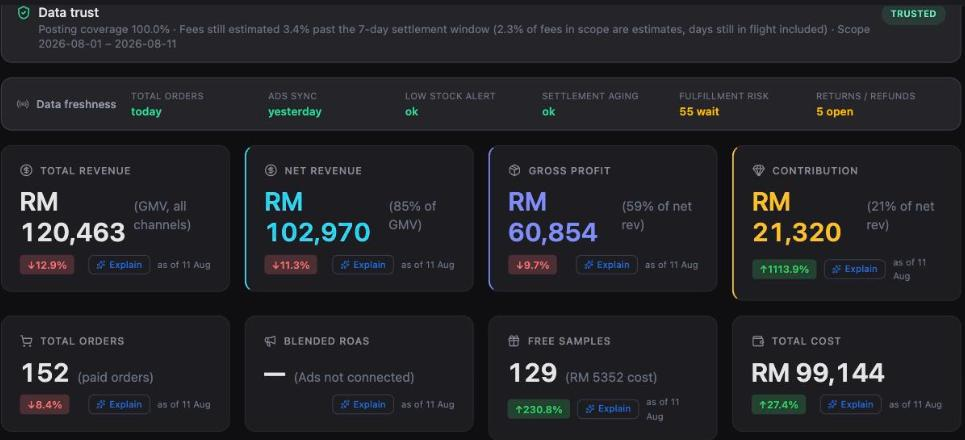
This is the most under-read part of the whole screen. On the demo workspace it reads:
Data trust                                              TRUSTED
Posting coverage 100.0% · Fees still estimated 3.4% past the
7-day settlement window (2.3% of fees in scope are estimates,
days still in flight included) · Scope 2026-08-01 – 2026-08-11
Piece by piece:
| Phrase | Meaning |
|---|---|
| Posting coverage 100.0% | Every order in the period has its financial lines posted. Below 100% means some orders are not yet contributing to the profit figures at all. |
| Fees still estimated 3.4% past the 7-day settlement window | Orders old enough that the platform should have settled them, but which Inseller is still pricing with an estimate. This is the number to watch — a rising share here means settlement data is not arriving. |
| 2.3% of fees in scope are estimates, days still in flight included | The overall estimated share, counting recent days that legitimately have not settled yet. This one is normally non-zero and that is fine. |
| Scope | The date range the two percentages were computed over — the same window as the reporting period. |
The badge (TRUSTED and its less happy siblings) is a summary, not a guarantee. If it is not TRUSTED, read the sentence — it names which of the two shares moved. Do not quote a profit number externally while the past-window estimate is high.
The Data freshness strip
Six fields, each answering "is this feed current?". Trust is about how settled the money is; freshness is about whether the pipes are running.
| Field | Reading it |
|---|---|
| TOTAL ORDERS — today | Orders have synced today. If it says a date several days back, your store connection needs attention — see Connect your store → Troubleshooting. |
| ADS SYNC — yesterday | Ad platforms report on a lag, so yesterday is normal here. Blank or stale by several days means the ad authorization has lapsed — see Connect your ads → Troubleshooting. |
| LOW STOCK ALERT — ok | Nothing has crossed its reorder threshold. |
| SETTLEMENT AGING — ok | Platform payouts are arriving on their normal schedule. This is the field that turns the Data trust estimate share red when it goes wrong. |
| FULFILLMENT RISK — 55 wait | A live count of orders waiting on you, not a health verdict. Click through to Orders to work the queue. |
| RETURNS / REFUNDS — 5 open | Open cases. These reduce revenue when they resolve, so a large number here is future downside already visible. |
The counts (55 wait, 5 open) are work queues, not warnings — they are supposed to be non-zero in a busy shop. It is the dates going stale that signal a broken connection.
The eight tiles
The top row is the profit chain — each row of it is the one above minus a category of cost. Read them left to right and you are reading a P&L.
| Tile | What it is |
|---|---|
| TOTAL REVENUE (GMV, all channels) | Gross merchandise value across every connected store. Before any deduction. This is the number platforms show you, and the one that flatters most. |
| NET REVENUE (85% of GMV) | What is left after platform fees. The sub-label is the share of GMV that survived — watch that percentage more than the ringgit figure, it moves when your channel mix or fee tiers change. |
| GROSS PROFIT (59% of net rev) | Net revenue minus product cost. This is the tile that only becomes real once SKU costs are set. |
| CONTRIBUTION (21% of net rev) | Gross profit minus the variable costs of selling — ads, affiliate commission, samples, vouchers. The closest thing on this screen to "did I actually make money". |
| TOTAL ORDERS (paid orders) | Paid orders only — cancellations excluded, so it will not match a platform dashboard that counts every order created. |
| BLENDED ROAS store-wide GMV ÷ all ad spend | Deliberately blunt: all revenue over all ad spend, across channels. Not a platform-attributed ROAS and not comparable to one. |
| FREE SAMPLES (RM 5,352 cost) | Units sent to creators and the cost they carry. Real money leaving, shown separately so it cannot hide inside COGS. |
| TOTAL COST | Everything deducted between GMV and contribution, in one figure. |
When no ad account is authorized, BLENDED ROAS shows that notice instead of a number.
Inseller refuses to print 0.00x, because a zero there would mean "you spent
nothing and sold anyway" when the truth is "we have no ad data source". Fix it in
Connect your ads.
The Explain button
Every tile carries Explain. It hands the tile, its value and its change to the AI copilot and asks for the top drivers and what to do today — using your own orders, ads and fees rather than a generic explanation. Use it when a number moved and you do not know why.
The view chips
All Today Finance
Ops filter which tiles are shown, and Layout: CEO view picks
the arrangement. Customize changes what appears; Download exports the current
view. None of them change the underlying numbers — only what is on screen.
The eight ⓘ breakdowns — the most useful thing on the screen
Every one of the eight tiles carries a small ⓘ next to its label. Hover it and the tile opens a full calculation panel: the formula at the top, then every component that went into the number, split by platform. This is where a figure stops being a number and becomes an argument you can check.
Each panel opens with the same two lines — a title and the formula it obeys:
| Tile | Panel title | Formula |
|---|---|---|
| TOTAL REVENUE | Total Revenue | GMV — every channel, before any fee |
| NET REVENUE | Net Revenue | Revenue − Platform Fees |
| GROSS PROFIT | Gross Profit | Net Revenue − COGS |
| CONTRIBUTION | Contribution Profit | Gross Profit − Ads − Fees − Samples − Voucher |
| TOTAL ORDERS | Total Orders | Paid orders in the period |
| BLENDED ROAS | Blended ROAS | GMV ÷ gross ad spend |
| FREE SAMPLES | Free Samples | Product cost + shipping actually charged |
| TOTAL COST | Total Variable Costs | Platform Fee + COGS + Ads |
There is no hover on touch — tap the ⓘ instead and the same panel opens.
1 · Total Revenue — GMV — every channel, before any fee
The panel splits GMV by platform and lets you jump straight to the orders behind it. This is the only tile on the row with nothing subtracted, which is exactly why it is the number marketplaces like to show you and the one that decides nothing.
2 · Net Revenue — Revenue − Platform Fees
The panel shows the fee side in detail, including how much of it is settled versus still accrued, and the weighted average fee rate the engine actually booked (for example TikTok avg 15.4%) rather than a rate typed into a settings page.
The average fee rate. It moves when your channel mix, category or campaign participation changes — and it moves before anyone tells you.
3 · Gross Profit — Net Revenue − COGS
COGS in this panel is SKU costing × quantity. Which means the panel is only as true as your cost table: any SKU you have not priced falls back to an assumption. Cross-check with Missing Cost SKUs before quoting this number.
4 · Contribution — Gross Profit − Ads − Fees − Samples − Voucher
The biggest panel of the eight, and the one worth learning properly. It takes gross profit and subtracts everything variable that selling actually cost you — then shows it per platform, side by side, so you can see which channel earned its keep.
Contribution Profit                                    RM 60,854
Gross Profit − Ads − Fees − Samples − Voucher          Gross Profit

  TikTok                              │  Offline
  TikTok Ads              RM 13,314   │  Offline            RM  4,602
    ↳ Live Ads            RM  8,255   │    ↳ Facebook Ads    RM  4,602
    ↳ Product Ads         RM  5,059   │
  Live fee                RM  7,347   │  Live fee                   —
    RM 48,979 × 15.0%               │  Affiliate fee              —
  Affiliate fee           RM  4,204   │
    RM 42,044 × 10.0%               │  Offline cost        RM  4,602
  Sample cost             RM  4,558   │
    110 samples · 110 units         │
  TikTok voucher          RM  4,715   │
  TikTok cost             RM 34,138   │

  − Total ads       (14.9%)                            RM 17,916
  − Live fee         (6.1%)                            RM  7,347
  − Affiliate fee    (3.5%)                            RM  4,204
  − Sample cost      (3.8%)                            RM  4,558
  − Ext sample cost  (0.7%)                            RM    794
  − Seller voucher   (3.9%)                            RM  4,715
  = Contribution                                       RM 21,320

  TikTok: RM 7,014 (32%)   │   Offline: RM 15,100 (68%)
  ROAS (Revenue ÷ Ads)                                      6.7x
Five things in that panel are worth knowing by heart:
| Line | What it actually is |
|---|---|
| Live fee RM 48,979 × 15.0% |
The live-stream commission — and note the base: it is charged on non-affiliate GMV, not on all TikTok sales. Affiliate-driven orders pay the affiliate fee instead, so charging both on the same order would double-count. |
| Affiliate fee RM 42,044 × 10.0% |
Creator commission on the GMV creators actually drove. The panel shows the base and the rate, so you can audit both. |
| Sample cost 110 samples · 110 units |
Real product cost of samples shipped to creators, with the unit count — not a percentage of retail. |
| Ext sample cost | Samples through an external affiliate manager, kept as its own line so agency spend never hides inside your own sample budget. |
| Seller voucher | Discounts you funded, as opposed to platform-funded ones. This is the line most sellers forget is real money. |
In the panel above, contribution is RM 21,320 — but only RM 7,014 (32%) came from TikTok, against RM 15,100 (68%) offline. TikTok produced most of the revenue and a third of the profit. That single line is the reason this panel exists, and you cannot see it anywhere else on the dashboard.
Total ads 14.9% · Live fee 6.1% · Affiliate fee 3.5% · Sample cost 3.8% · Seller voucher 3.9%. Ringgit amounts move with volume; these shares move with how you run the business. A voucher share drifting from 2% to 4% is a discounting habit forming.
5 · Total Orders — Paid orders in the period
Paid only, cancellations excluded, split by platform. This is why the number will not match a marketplace dashboard that counts every order created.
6 · Blended ROAS — GMV ÷ gross ad spend
Deliberately blunt: all revenue over all ad spend, no attribution window. It answers "for every ringgit of ads, how much did the whole business sell" — which is the question your bank account asks. A platform's own ROAS answers a narrower one and will almost always look better.
7 · Free Samples — Product cost + shipping actually charged
Note actually charged. Not an estimate, not a percentage of retail — the real cost of the goods plus the shipping that was really billed. It is the honest version of a number most sellers carry in their head as "a few free products".
8 · Total Cost — Platform Fee + COGS + Ads
Titled Total Variable Costs in the panel, and that title is the important part: this is what scales with sales. It is not your total business cost — rent, salaries and subscriptions are not in here.
Variable costs only. Subtracting it from revenue gives you contribution, not net profit. Your fixed costs still have to come out of what is left.
Estimated vs settled — the honest boundary
This is the part worth internalising, because it decides which decisions this dashboard can carry and which it cannot.
| Number | How solid |
|---|---|
| Revenue / orders | Settled. Pulled from the platform's own order records. |
| Platform fees | Estimated until the platform settles, then replaced with the real figure. The Data trust banner tells you what share is still estimated right now. |
| Product cost | Real per SKU only for the SKUs you have priced. Anything not in your cost table falls back to a percentage assumption. That is why Missing Cost SKUs is the tab that decides whether gross profit means anything. |
| Ad spend | Settled where an ad account is connected. Where it is not, it is absent — not zero. |
Do not quote per-SKU margin as fact while a chunk of your catalogue has no cost set — the figure is partly a percentage assumption wearing a per-SKU label. Clear the missing-cost list first, then the number is yours to quote.
Before acting on a margin number, ask two questions: is the cost real or assumed? and are the fees settled or estimated? The dashboard answers both — the cost question in SKU Costs, the fee question in the trust banner.
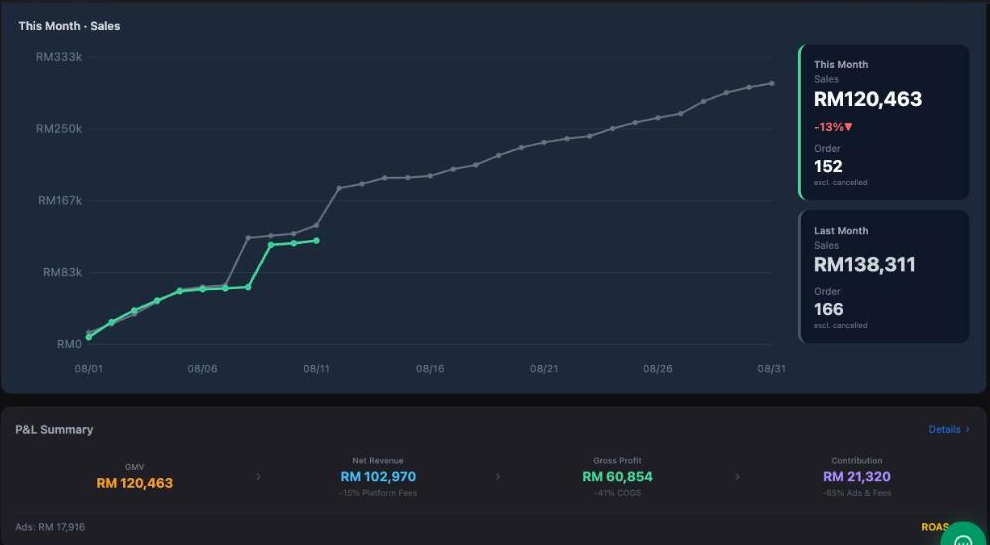
Analytics — the same money, shown as a chain
Analytics in the sidebar.
Where the dashboard gives you tiles, Analytics gives you the trend line and the P&L chain in one row — each step labelled with the percentage it removed.
 1
2
1
2
The ringgit figures move with volume; the percentages move with your business. A COGS share creeping from 38% to 41% is a supplier or a discount problem that a rising revenue line will happily hide.
A two-minute daily read
- Trust banner — still TRUSTED? Has the past-window estimate share moved?
- Freshness — are the two dates (orders, ads) current?
- Contribution, not revenue — is it up, and is its percentage of net revenue holding?
- Anything that moved and surprised you → hit Explain on that tile.
Common misreadings
"My revenue does not match TikTok Seller Center"
Usually order-status scope: Inseller's TOTAL ORDERS counts paid orders and excludes cancellations, while platform dashboards often count everything created. Check the period line too — a platform default of "last 30 days" is not the same window as "this month".
"Gross profit looks too good"
Almost always unpriced SKUs falling back to an assumed cost percentage. Open Missing Cost SKUs — if affected revenue is not near zero, your gross profit is carrying an assumption.
"Contribution collapsed this month"
Check whether an ad account was connected mid-period. Contribution correctly drops the day ad spend starts being counted — the previous months were overstated, not this one understated.
"The percentage change looks impossible"
A change against a near-zero prior period produces huge percentages (the demo shows +1113.9% on contribution for exactly this reason). Read the absolute figures when the prior period was tiny.
"Blended ROAS is lower than my platform's ROAS"
Expected. Blended ROAS divides all revenue by all ad spend with no attribution window; a platform reports the revenue it claims credit for. They answer different questions — blended is the one that ties to your bank account.
Was this page helpful?