Live Performance carries seven tabs and they are not variations on one report — each
answers a different question, and three of them exist because the obvious answer would be
wrong. This page goes through all of them.
⏱ 12 min read
Screen: Live Performance
Requires: TikTok Shop connected
Updated 2026-08-11
1
The seven tabs, and which question each answers
Tab
The question it answers
Arena
Are we on pace this month? Targets, today's schedule, team leaderboard — see Live & creators.
Which host, which slot, which day actually performs?
Meeting
What do I put in front of the team at the weekly review?
Content
Where is each video in the production pipeline?
Attribution
Who was on camera in that video?
Profit
Did each individual session make money?
One banner sits above all of them
"Import coverage looks good for 2026-08. All: 1/8–11/8" with a Re-import wizard
button. Read it before you read anything else — if coverage has gaps, every tab
below is reporting on partial data.
2
Analytics — who and when actually performs
1234
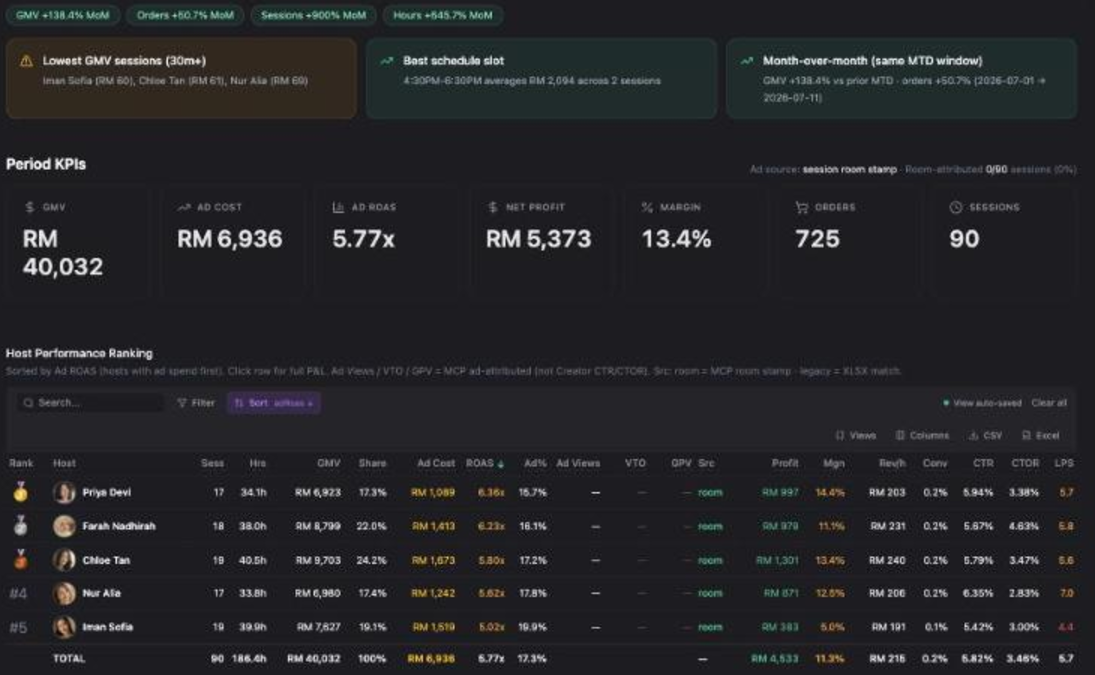
① month-over-month chips. ② three insight cards, including
Lowest GMV sessions (30m+) naming the hosts. ③ the host ranking,
sorted by Ad ROAS. ④ revenue by schedule slot — the bar chart that tells you
which time window earns.
Period KPIs across the top: GMV · AD COST · AD ROAS · NET PROFIT · MARGIN · ORDERS ·
SESSIONS. The ranking below carries per-host Sess · Hrs · GMV · Share · Ad Cost ·
ROAS · Ad% · Profit · Mgn · Rev/h · Conv · CTR · CTOR · LPS.
It is sorted by Ad ROAS on purpose
The header says so: "Sorted by Ad ROAS (hosts with ad spend first)".
Sorting by GMV would put whoever had the biggest ad budget on top — which tells you
nothing about the host.
Check the attribution note before trusting Ad ROAS
Next to the KPIs: "Ad source: session room stamp · Room-attributed 0/90 sessions (0%)".
That percentage is how many sessions had ad spend attributed by room stamp. At 0%,
the per-host ad numbers are coming from a fallback, not from a room-level match — read
them as directional.
Schedule Slots (Revenue, RM) is the chart to act on: in the capture above,
7:30pm–9:30pm earns RM 10,190 against RM 1,444 at 1pm–3pm. That is your
answer to "should we keep the afternoon slot".
3
Profit — did this session make money?
The only screen in Inseller that puts a full P&L on one broadcast. This is where a
busy-looking slot turns out to have lost money.
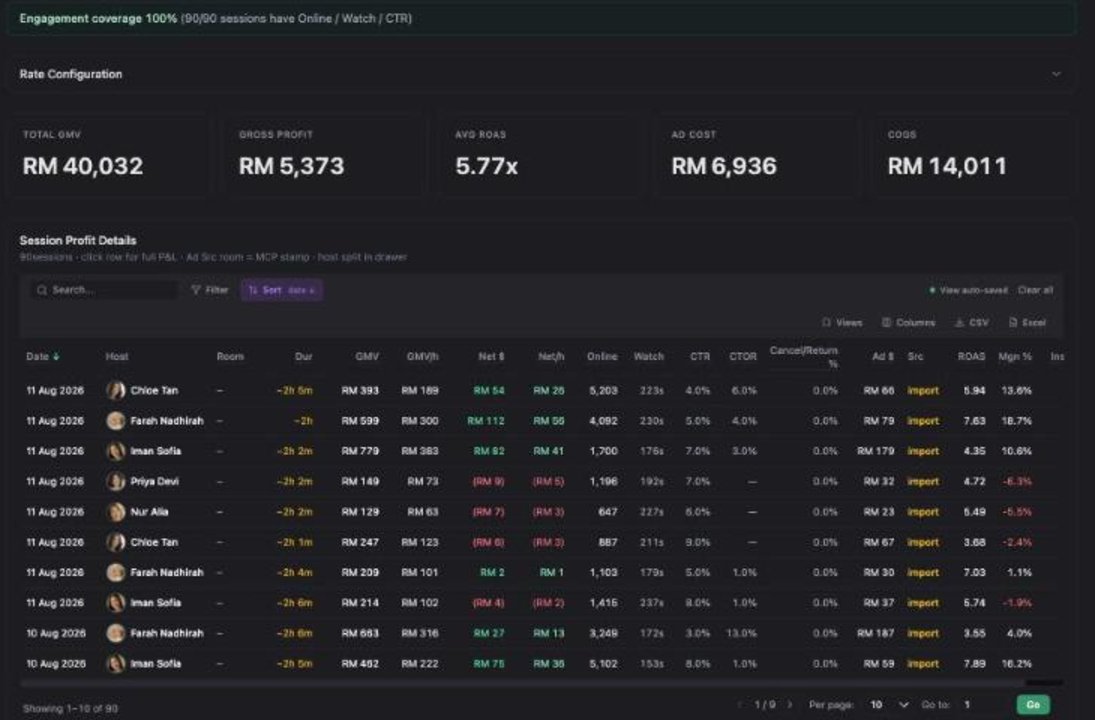
1234
①Engagement coverage 100% — how many sessions have Online / Watch / CTR
data. ② the five KPIs: TOTAL GMV · GROSS PROFIT · AVG ROAS · AD COST · COGS.
③ the Net column — note the red bracketed rows: those sessions lost
money. ④ margin %.
Session Profit Details carries the instruction in its own subtitle:
"click row for full P&L · Ad Src room = MCP stamp · host split in drawer".
Columns run Date · Host · Room · Dur · GMV · GMV/h · Net · Net/h · Online · Watch ·
CTR · CTOR · Cancel/Return % · Ad · Src · ROAS · Mgn %.
The negative rows are the point of this screen
In the capture, one session shows GMV RM 149 → Net (RM 9) → Mgn −6.3%. It ran, it
sold, and it still cost you money once the host's time and the ad spend were counted.
You cannot see that anywhere else — the leaderboard would show it as RM 149 of
sales.
Rate Configuration
The collapsed panel above the KPIs. It is where the rates behind this P&L are set, and
it is the first place to look if a session's cost looks wrong. Host hourly rate and
commission come from Host Settings.
Read GMV/h and Net/h, not GMV
A four-hour session should out-sell a two-hour one. The per-hour columns are the only
fair comparison, and Net/h is the one that survives contact with payroll.
4
Meeting — the pack for your weekly review
Subtitled "Weekly attendance · MoM performance · commission — ready for ops reviews".
This tab exists so nobody has to build a deck.
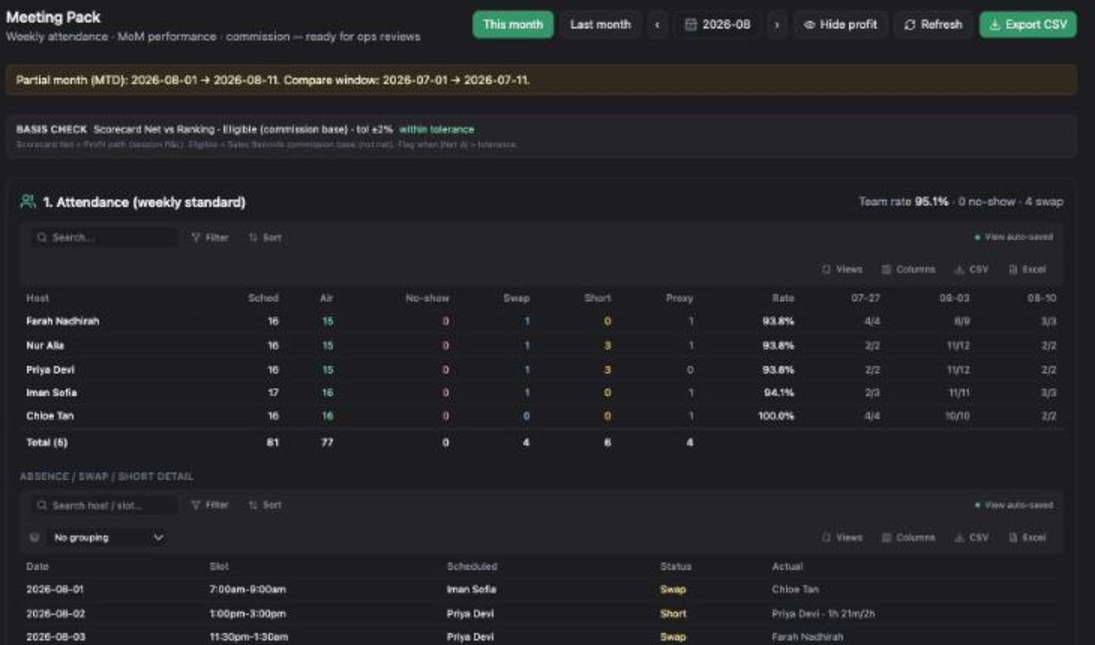
123
①BASIS CHECK — reconciles two different commission bases before you pay
anyone. ② attendance per host with a weekly rate. ③ABSENCE / SWAP / SHORT DETAIL — every incident, dated.
Read the BASIS CHECK first
The banner spells out what it compares:
BASIS CHECK   Scorecard Net vs Ranking · Eligible (commission base) · tol ±2%   within tolerance
Scorecard Net = Profit path (session P&L). Eligible = Sales Records commission base (not net).
Flag when |Net Δ| > tolerance.
Why this matters on payday
Two systems can disagree about what a host earned commission on — the session P&L
path and the sales-records path. This check compares them within ±2% and says
within tolerance or flags it. If it is flagged, do not run commission until you
know which number is right.
Attendance
Per host: Sched · Air · No-show · Swap · Short · Proxy · Rate, plus one column per
week. The header carries the team summary — in the capture,
Team rate 95.1% · 0 no-show · 4 swap.
Under it, ABSENCE / SWAP / SHORT DETAIL lists each incident with
Date · Slot · Scheduled · Status · Actual — for example
2026-08-02 · 1:00pm–3:00pm · Priya Devi · Short · Priya Devi · 1h 21m/2h.
This is the table you open when someone disputes a deduction.
Performance and the controls
Section 2 compares this period against the previous one:
GMV · CANCELLED GMV · NET GMV · ORDERS · HOURS · SESSIONS · AD ROAS · PROFIT.
Note NET GMV is marked settleable · matches $5 — cancellations are already out.
Control
Use
This month / Last month + month arrows
Pick the review period.
Hide profit
Turn this on before you screen-share with hosts. Attendance and performance stay; margins disappear.
Export CSV
The whole pack, out. For payroll or for a manager who does not have a login.
Partial month warning
When you are mid-month it says so: "Partial month (MTD): 2026-08-01 → 2026-08-11.
Compare window: 2026-07-01 → 2026-07-11." — like-for-like, and it tells you it is
doing that.
5
Content — the video pipeline (with the calendar view)
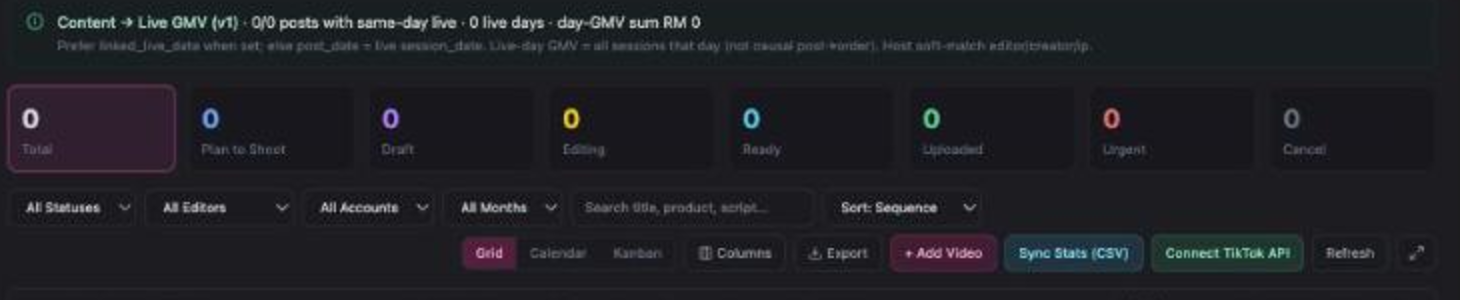
A production tracker for short-form: every video from idea to uploaded, in three different
views.
123
① the attribution caveat — read it before quoting any content→GMV number.
② the status funnel: Total · Plan to Shoot · Draft · Editing · Ready ·
Uploaded · Urgent · Cancel. ③ the view switch —
Grid · Calendar · Kanban.
View
Use it for
Grid
The full table — video title, product, status, account, script, shoot date, post date, editor.
Calendar
Publishing schedule by date. Drag a video to a different day to reschedule it. This is the view for spotting gaps in the posting cadence.
Kanban
The pipeline as columns — drag a card between statuses as it moves from Plan to Shoot through Editing to Uploaded.
Content → Live GMV is correlation, not causation — the product says so
The banner reads: "Prefer linked_live_date when set; else post_date = live session_date.
Live-day GMV = all sessions that day (not causal post→order). Host soft-match
editor/creator/ip."In plain terms: it shows you the GMV of the day a video went out, not the GMV that
video caused. Useful as a signal, wrong as a claim.
Controls: + Add Video, Sync Stats (CSV), Connect TikTok API for
automatic view/like counts, plus filters by status, editor, account and month.
6
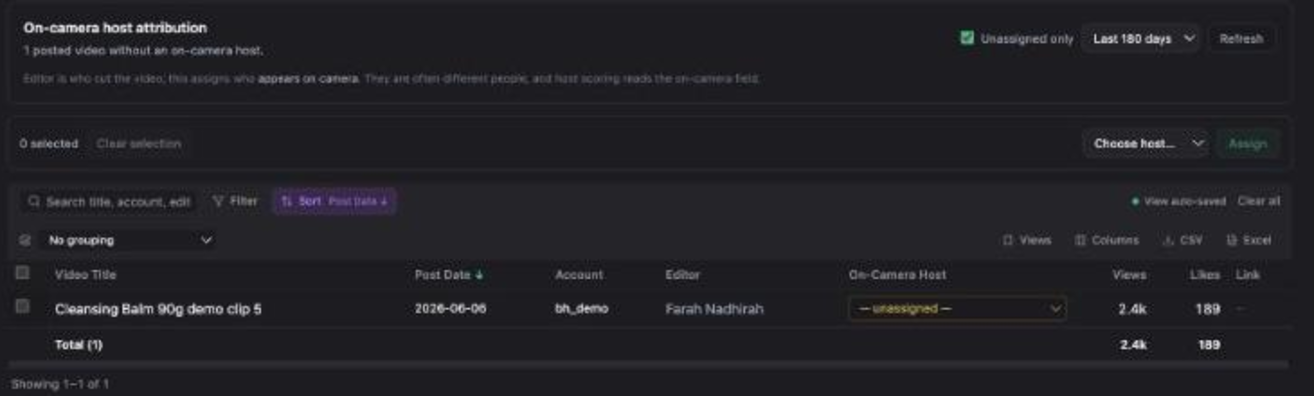
Attribution — who was actually on camera
On-camera host attribution
A small tab that fixes a specific unfairness. The screen explains itself:
Editor is who cut the video, this assigns who appears on camera.
They are often different people, and host scoring reads the on-camera field.
12
① the count of videos still missing an on-camera host, with an
Unassigned only filter and a lookback window. ② the
On-Camera Host dropdown — set it, then Assign.
Do this before you review host content scores
Host scoring reads the on-camera field, not the editor field. Leave videos
unassigned and the person who actually appeared gets no credit — while the editor may
appear to have produced content they were never in.
7
Data & imports — the three tabs under Settings ▾
Everything above depends on live data actually arriving. Three of the eight items in
Settings ▾ exist for that.
Tab
What it does
Upload Data
The manual route for live analytics. Its own instructions:
"1. TikTok Shop → LIVE analytics → select date range → Export (.xlsx)
2. Drop each studio's file into its own card below — each Creator Center export is
per-account."One card per studio — dropping a file in the wrong card mislabels
the sessions.
Data Status
Coverage per day. The place to confirm the banner's "Import coverage looks good" claim before a review.
Import History
Every past import — source, records, result. Where you check whether last night's upload actually landed.
The other five — Host Settings · Studios · Schedule slots · Targets · Challenges —
are covered in Run your live team.
Re-import wizard
The button on the coverage banner. Use it when Data Status shows a gap — it walks the
missing dates rather than making you re-upload the whole month.
A weekly review in tab order
Coverage banner — is the month complete? If not, fix that first.
Meeting → BASIS CHECK — within tolerance? Commission is safe to run.
Meeting → Attendance — team rate, then the absence/swap detail for the conversations.
Analytics → Schedule Slots — which windows earn, which to cut.
Profit → sort by Mgn % — the negative sessions. That is your agenda.
Attribution — clear unassigned videos before anyone's content score is discussed.
Troubleshooting
Ad ROAS per host looks wrong or suspiciously uniform
Check the Room-attributed n/n sessions note next to the Period KPIs. When that is 0%, ad spend was not matched to sessions by room stamp and the per-host split is a fallback. It is directional, not an allocation you should pay anyone on.
BASIS CHECK is flagged
The session-P&L net and the sales-records commission base differ by more than ±2%. Usually a cancelled or returned order landed on one path and not yet the other. Wait for settlement or reconcile before paying commission — do not just pick the bigger number.
Engagement coverage is below 100%
Some sessions have no Online / Watch / CTR data, so funnel metrics for those are blank. That usually means the live analytics export for those dates has not been uploaded — check Data Status, then use the Re-import wizard.
A host says their content was credited to someone else
They are probably right. The video's On-Camera Host is unset, so the editor field is all the system has. Fix it on the Attribution tab — it is a dropdown and an Assign button.
Content shows GMV against a video and I want to quote it
Don't. The banner states it is the live-day GMV of that day's sessions, explicitly not causal post→order. Quote it as "this video went out on our best day", never as "this video produced RM X".

 1
2
3
1
2
3